ChartBrick: AI-Driven Chart Creation
Quick summary
- AI-powered chart creation from multiple data sources.
- No-code platform with diverse chart types.
- Seamlessly integrate, share, and embed anywhere.
ChartBrick is an innovative tool that allows users to create charts and dashboards effortlessly using data from Notion, Google Sheets, and more. Leverage AI technology to generate visually appealing charts without any code. This advanced platform is perfect for those looking to embed interactive dashboards across various platforms seamlessly.
From consultants to content creators and freelancers, ChartBrick offers a comprehensive solution for visual data representation. With unlimited sharing and embed options, it’s an invaluable resource for anyone needing to communicate data effectively. Discover the advantages of using ChartBrick for your data visualization needs.
What ChartBrick Does?
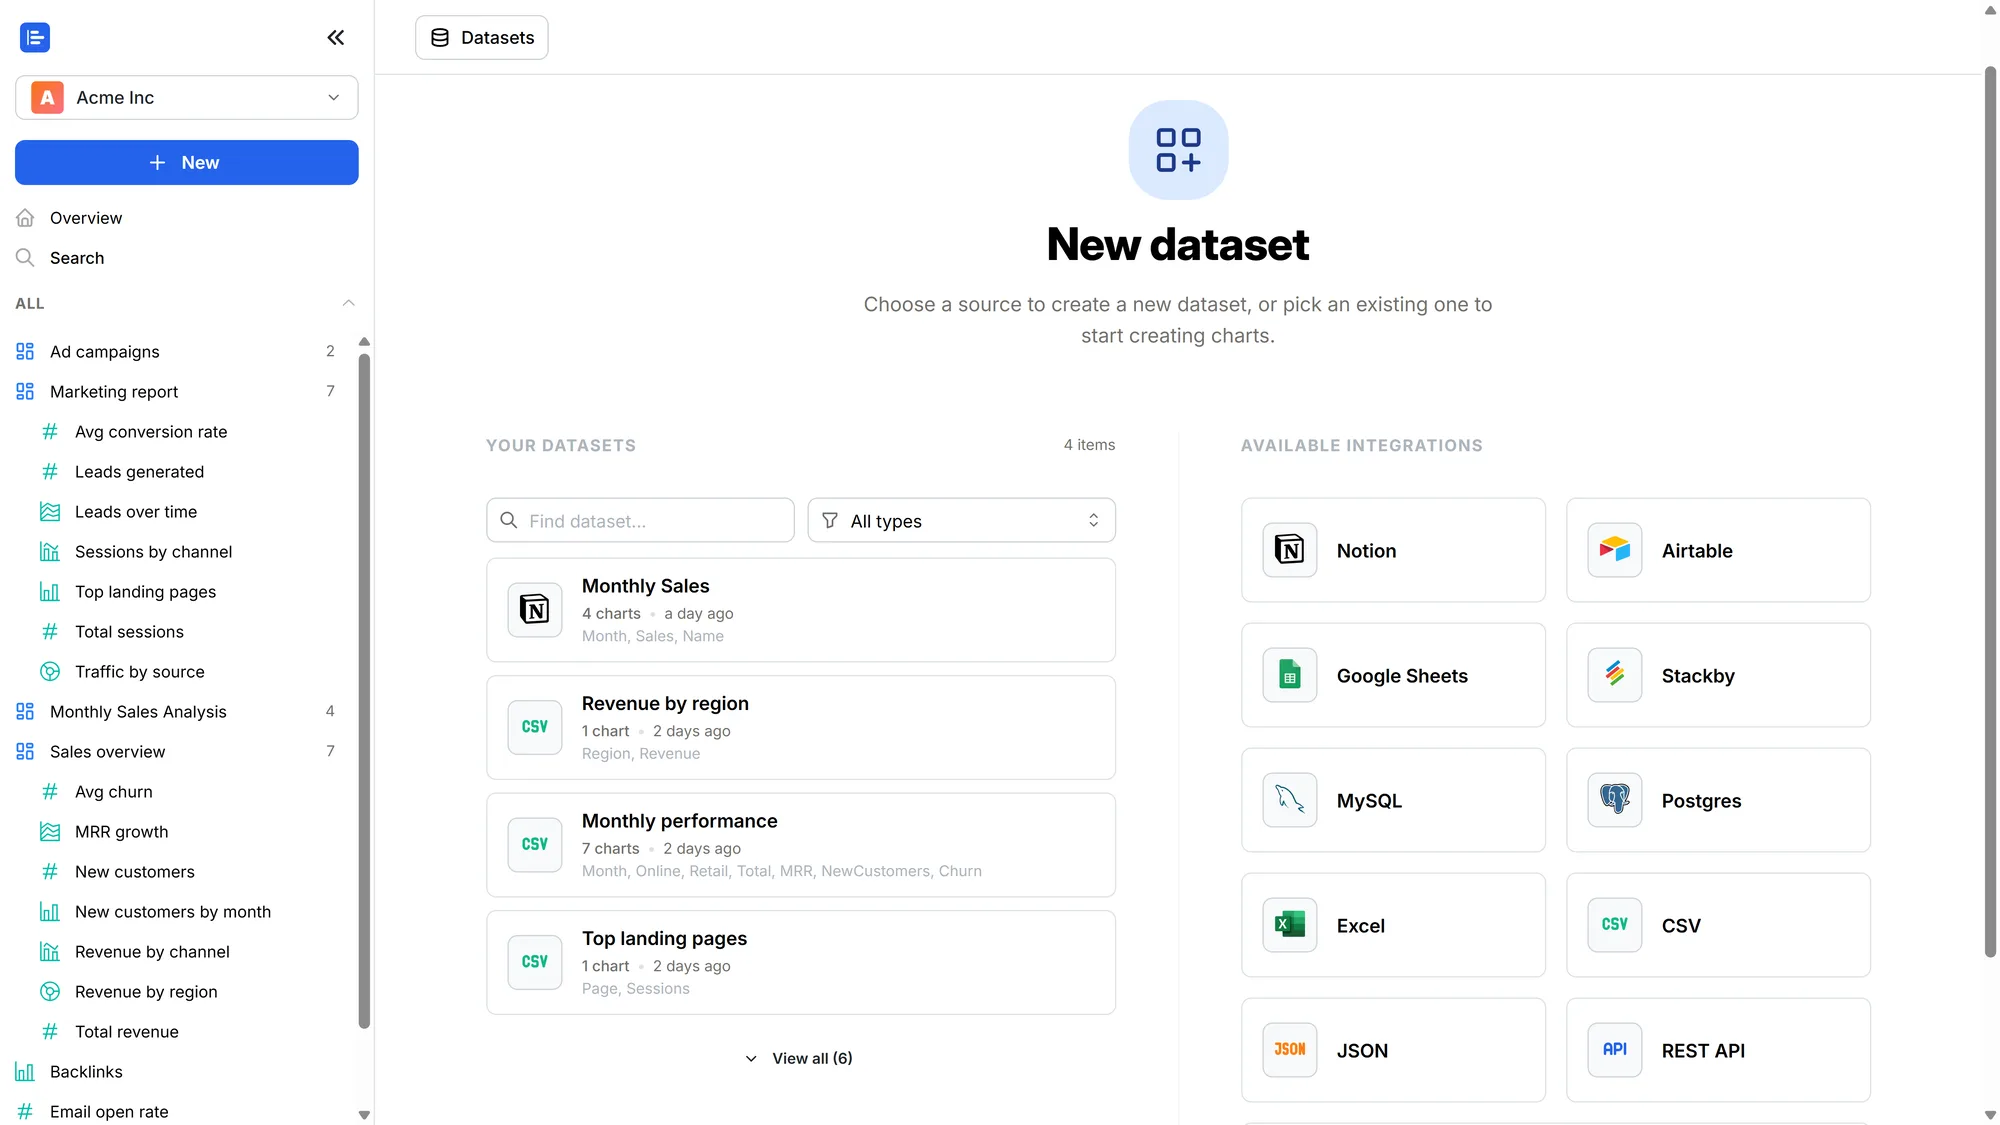
ChartBrick facilitates the creation of charts and dashboards using data from various platforms like Notion, Google Sheets, and Airtable. It provides a no-code environment where users can easily turn their raw data into insightful visualizations. By integrating seamlessly with multiple data sources, ChartBrick offers unparalleled flexibility in data representation.
The tool’s AI chart generation feature automates the design process, making it accessible for users without technical expertise. Whether you’re embedding dashboards within business reports or crafting interactive charts for presentations, ChartBrick ensures a smooth and efficient workflow.
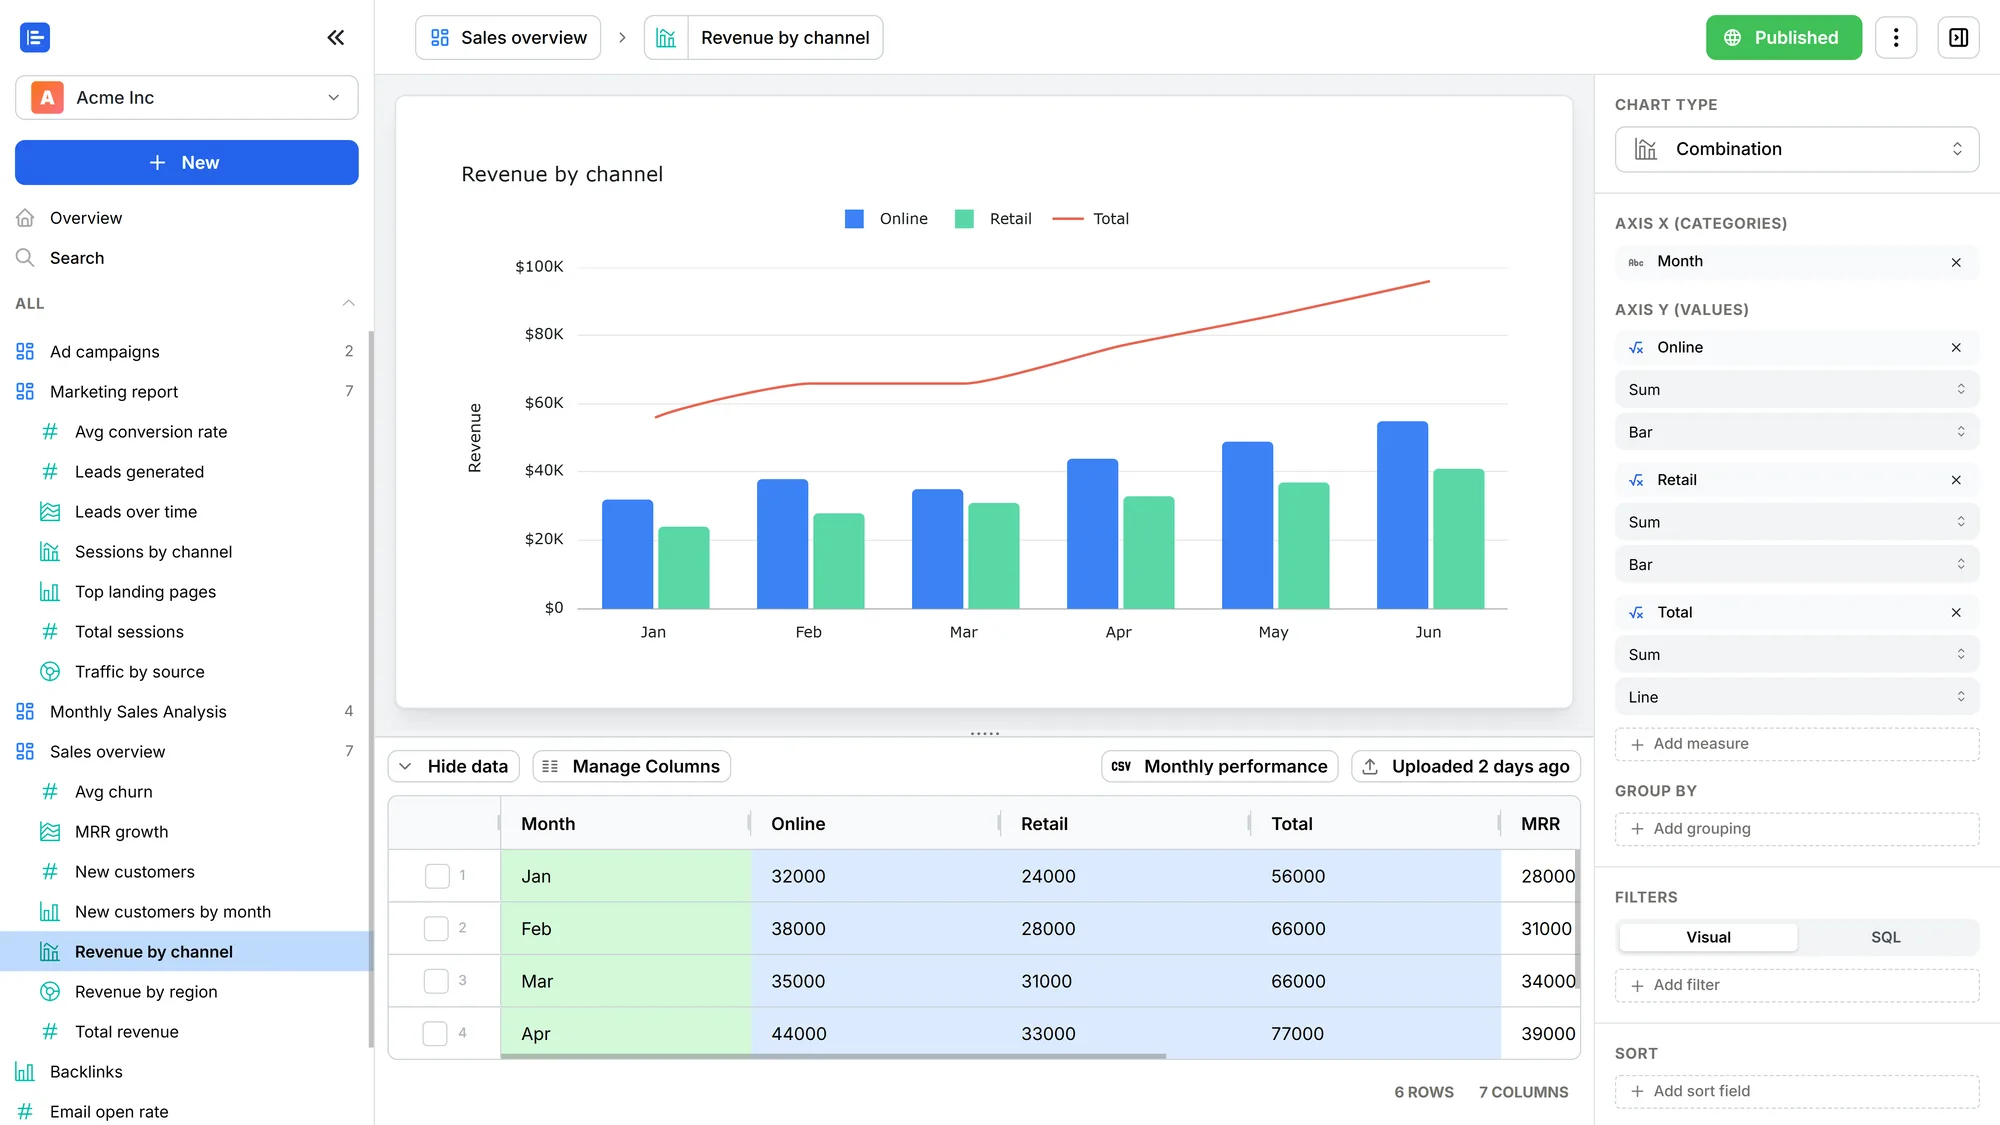
Incorporating an easy sharing system, you can share your visualizations via links or embed them live on any website. It supports over 20 different chart types, giving users the freedom to choose the best format to display their data insights effectively.
How to use ChartBrick?
Using ChartBrick involves a straightforward process that ensures maximum functionality with minimal effort.
- Begin by importing your data from Notion, Google Sheets, Airtable, or other supported databases.
- Utilize the AI-driven chart generation to automatically design your dashboards.
- Customize the chart appearance by selecting from over 20 chart types.
- Share or embed your created charts using direct links or live embeds anywhere on the internet.
- Set up scheduled auto-refresh to keep your data visualizations up to date.
Key Differentiators
ChartBrick stands out from competitors like Microsoft Excel and Tableau primarily due to its AI integration and ease of use. Unlike traditional tools that require manual chart creation, ChartBrick employs artificial intelligence to automate this process, saving users valuable time. Its no-code environment makes it extremely user-friendly for individuals without technical skills.
Additionally, while Excel and Tableau offer robust data analysis and visualization capabilities, they often require significant learning curves. ChartBrick, on the other hand, provides instant functionality with built-in features like scheduled auto-refresh and unlimited charts, making it accessible and efficient for all users.
Pros and Cons
Pros
- AI-driven chart generation simplifies the creation process.
- No-code platform suitable for users of all skill levels.
- Integrates with multiple data sources like Notion and Google Sheets.
- Unlimited sharing and embedding capabilities.
- Diverse chart types for versatile data representation.
Cons
- Limited integration options with certain platforms.
- Lacks some advanced chart customization features found in competitors.
Overall, while there are some areas for improvement, ChartBrick offers a robust solution for effective data visualization. Its user-friendly interface and AI-powered features make it an appealing choice for professionals seeking efficient chart creation tools.
Who Is It For?
ChartBrick is ideal for consultants, content creators, and freelancers who need a reliable tool for transforming data into meaningful visualizations. Its effortless integration with Notion and Google Sheets provides an advantageous solution for those already using these platforms. Moreover, the ability to share and embed live dashboards amplifies its utility across various industries.
Whether you’re preparing for an important presentation or enhancing a business report, ChartBrick delivers the tools necessary to build engaging and informative visual content. Its versatility ensures it’s a worthwhile investment for anyone seeking an efficient way to manage and communicate data insights.
Product images


At a glance
| Alternative to |
Microsoft ExcelTableau
|
|---|---|
| Integrations |
AirtableExcelGoogle SheetsMySQLNotion
|
| Best for |
ConsultantsContent creatorsFreelancers
|
Is it worth it?
ChartBrick offers substantial value, making it worth considering for anyone dealing with data visualization. The seamless integration with platforms like Notion and Google Sheets, coupled with AI-driven chart generation, makes it perfect for consultants and freelancers. At the current price of $49, it presents a cost-effective option compared to traditional software like Tableau.
The 60-day money-back guarantee provides a risk-free opportunity to experience its features, ensuring you have the confidence in your investment. For those prioritizing ease of use and versatility in data presentation, ChartBrick is clearly a smart investment.

About Daniel Seoane Pardo
Compared to alternatives
| Feature | ChartBrick | Microsoft Excel | Tableau |
|---|---|---|---|
| AI Chart Generation | Yes | No | No |
| No-Code Environment | Yes | Yes | Partial |
| Integrations | Notion, Google Sheets, Airtable | Extensive | Extensive |
| Chart Types | 20+ | 20+ | Extensive |
| Price | $49 | Subscription-based | Subscription-based |
| Embed Anywhere | Yes | Partial | Yes |
* Based on publicly available information.
What users are saying
What users like
Users report being impressed with the seamless integration with Notion and Google Sheets, allowing for efficient data management. Many reviewers highlight the platform’s ease of use and the variety of chart types available, providing a comprehensive toolkit for data visualization needs.
Common concerns
Some mention a desire for more integrations with other platforms and note that while there is a wide range of chart types, additional customization options could enhance the overall user experience.
FAQ
How does ChartBrick integrate with other platforms?
ChartBrick integrates seamlessly with Notion, Google Sheets, Airtable, and more, allowing users to import and visualize data from multiple sources.
Is there a money-back guarantee?
Yes, ChartBrick offers a 60-day money-back guarantee, giving users the confidence to explore its features without risk.
What are the data storage options?
ChartBrick allows unlimited datasets and dashboards, providing flexibility in data storage and management.
Can charts be embedded on any site?
Yes, ChartBrick supports embedding charts live on any site, enhancing data visibility and accessibility.
How does AI chart generation work in ChartBrick?
The AI features automatically analyze data and create visuals, allowing users to generate insightful charts without manual input.
Deal Terms
- Lifetime access to ChartBrick
- You must redeem your code(s) within 60 days of purchase
- All future plan updates
- Please note: This deal is not stackable
Related products

Letterly: Turn Speech to Perfect Text
Letterly is a versatile tool that turns any speech into the perfect text you need. With its cross-device capabilities, you can dictate...
Dr.Buho Bundle: Clean and Organize Effortlessly
Dr.Buho Bundle is your ultimate toolkit for maintaining a well-ordered Mac. Offering a Mac cleaner, NTFS manager, and a redesigned app launcher,...

Amical: Speech-to-Text Across Apps
Amical is an intuitive AI-driven tool that dictates text in your favorite apps. With support for over 100 languages, it turns your...